
Multi-level analysis
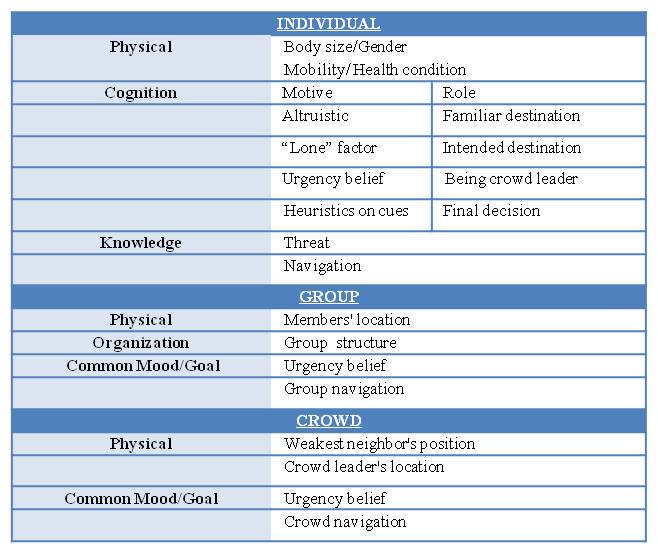
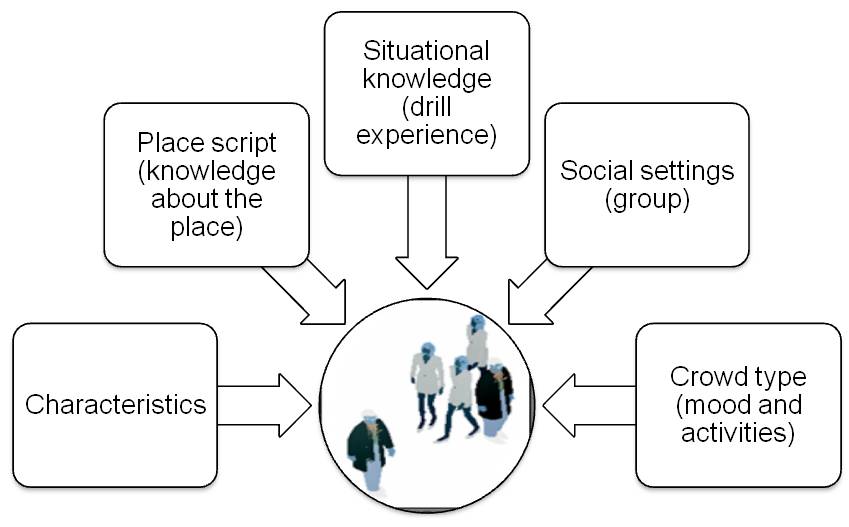
We propose a systematic framework to study the micro (individuals and small groups) and macro levels (larger group and crowd). Figure 1 presents the highest level of organization of the analysis consisting of individual, group and crowd. We categorize the variables in each social theory in this representation framework.
The summary of the mechanisms derived from the social theories and the list of variables extracted from social theories are presented in the below tables.
Summary of Theories
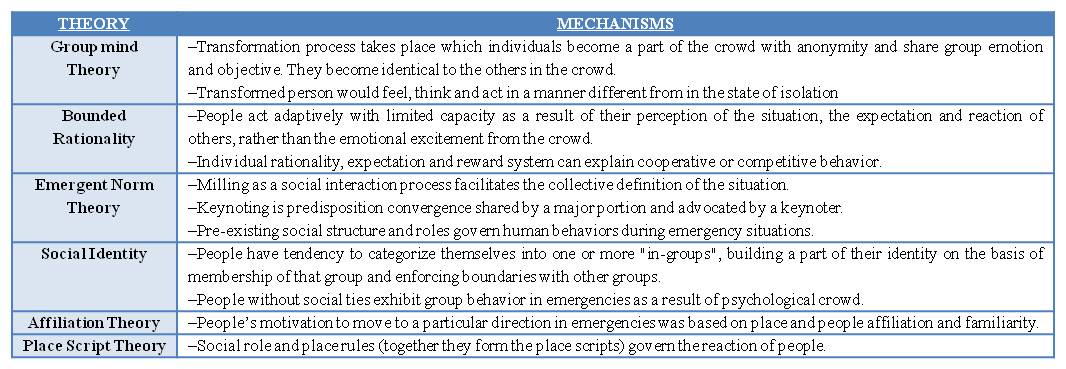
Table of Social Variables
The Design of a Social Agent
Locomotions
Navigation
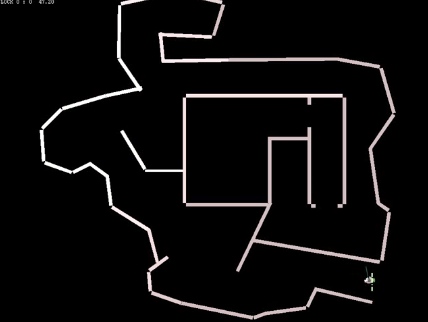
Agents preceive the physical geometry of the floor at each step. Without prior knowledge of the environment (random explore), they calculate the direction which leads to potential open space rather than dead-end and are capable in "memorizing" the area they have been to.
The following video shows a single agent exploring in an unknown complex floor
 Movie
Movie
Group Navigation
Group and crowd flow can also affect the group movement patterns. The effect of group on agent's navigation may be described as follow: At the perception stage, an agent detects the neighboring agents within a specified radius and calculates the crowd density and the crowd flow direction. At the execution stage, when encountering cross flows in a dense crowd, the agent temporarily resets its navigation target from its original target to nearby group members (according to the separation distance and the member's influence).
The figure below shows the patterns of groups in different crowd flow situations. The agents are assigned to different groups and the lines joining the agents indicate the presence of social ties between the agents. As shown in the figure below, without any cross flow, the groups tend to walk as a cluster with formation in a V-shape or horizontally along the travelling direction. Figure 3b shows the emerging lane-forming patterns as groups are crossing each other in opposite direction.
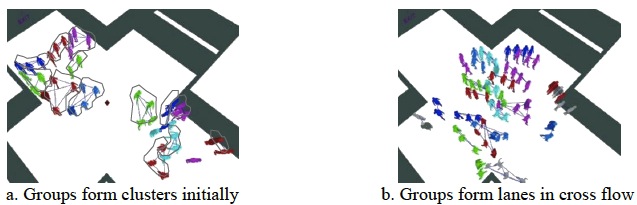
Different group walking pattern in different flow situations
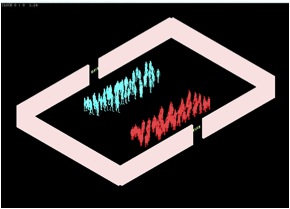
Bi-directional flow
People follow other ahead of them in dense crowd. Agents preceive their surroundings, including the neighbouring agents, to assess the viable steps
The following videos are the single simulation run showing two groups of agents heading to opposite direction and forming streams when corss over.
 Movie-isometric view
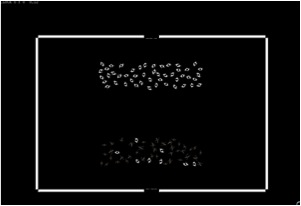 Movie-plan view
Simple Social Behaviors
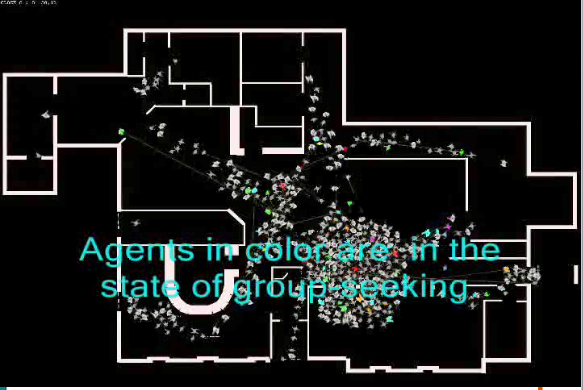
Group-seeking
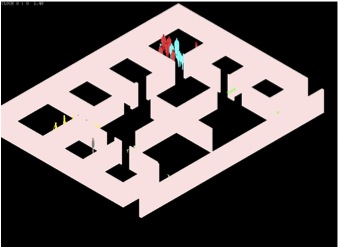
The normative theory and the affiliation theory suggested that, even under an emergency situation, people demonstrate group behavior rather than individual behavior. They search for members who are in relation with them or with the same identity. Members of a group tend to stay together while migrating to exit. In our model, we assign the "closeness" of the group of agents. This group parameter determines the likelihood of the agent to seek for other group members in order to stay as a group and different levels of group closeness can be simulated.
The following videos are the single simulation run showing two groups of agents who are closely related and evacute together.
With a simple office floor plan
 Movie-isometric view
 Movie-plan view
Agents Interactions
Interaction with Staff
In the situation of egress, there are often interactions between the personnel in charge of the evacuation and the building occupants. Not only does this interaction change the occupants� belief to exit the building, in most of the case, the staffs also give instruction to the occupants of the exit direction. We derive a social agent which represents the staff. This special kind of agent can be assigned to a particular position and give specific instruction to the other agents on exiting route. A demonstration of such interaction is shown in the below video.
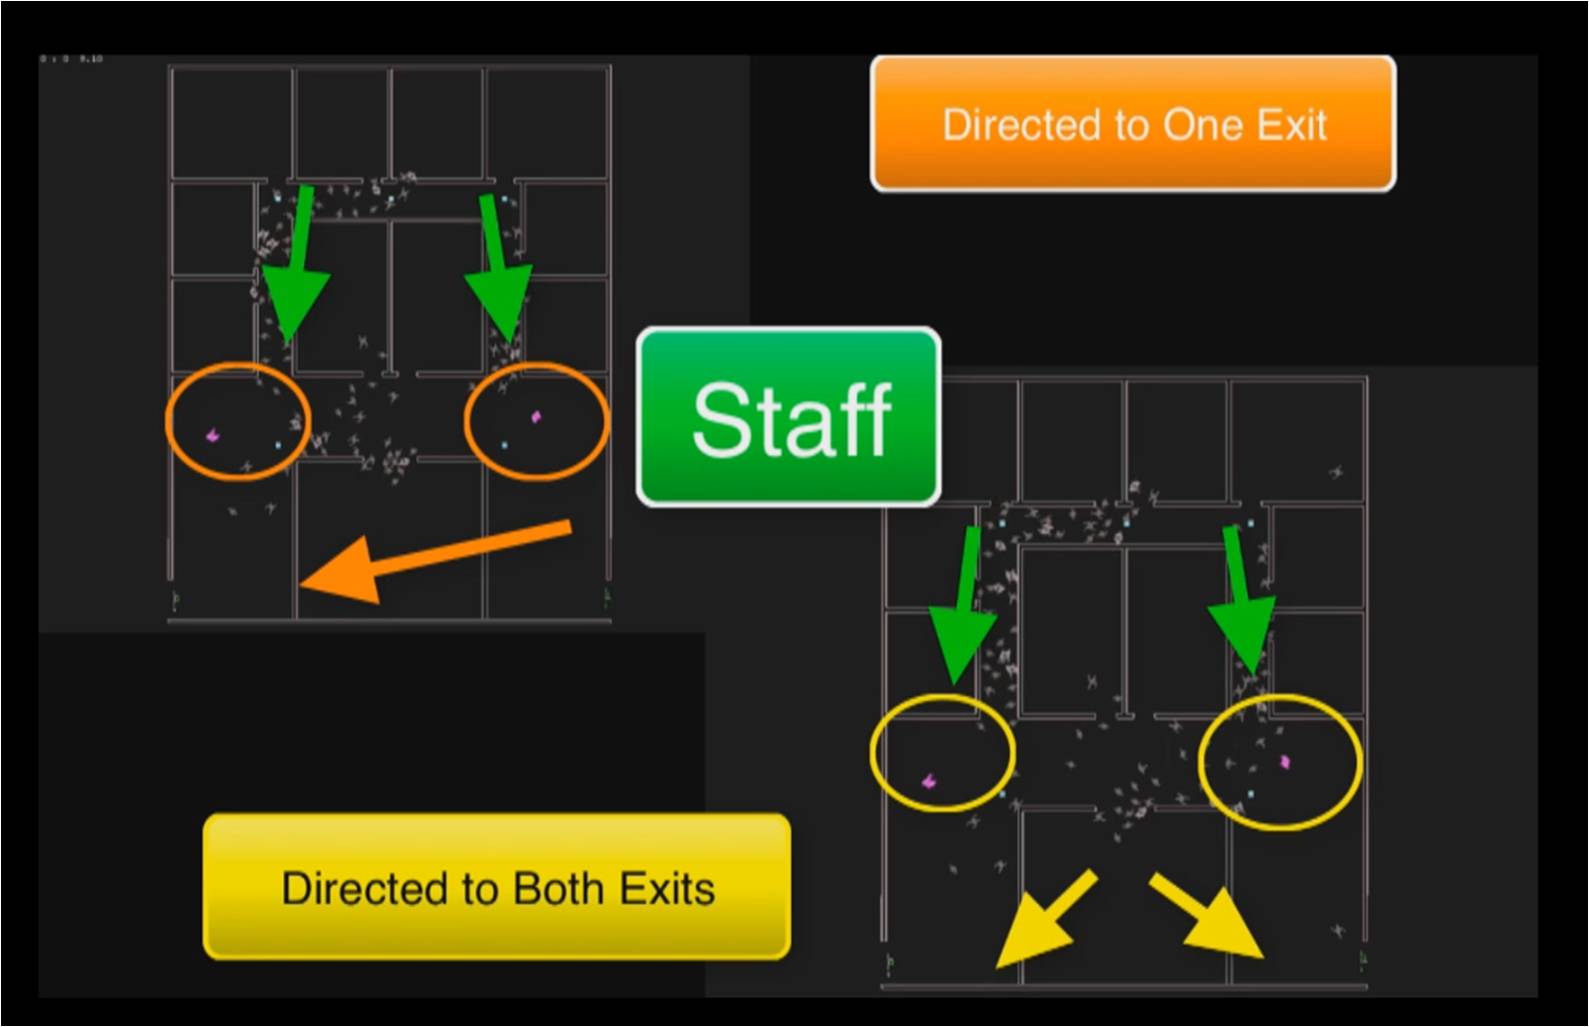 View movie
Validation
We adopt a bottom-up strategy to validate SAFEgres, which can be classified into 4 stages:
- Component testing - routine checking of major software components
- Functional testing - checking model capabilities and that these are compatible with intentions)
- Qualitative validation - comparing predicted human behavior with expectations
- Quantitative verification - comparison of model predictions with experimental data
In component testing, we first verify the accuracy of the fundamental components of an egress model by performing a series of elementary tests as outlined in IMO guidelines for simulation model verification. SAFEgress is designed to model occupant in emergency with individual sensing and certain cognitive capabilities, as well as ability to interact with other agents. To ensure the agents "function" as intended, we perform functional testing on the sub-components of the agent to ensure the agent is capable to perceive and respond to the environment and the crowd.
In qualitative validation, apart from carrying tests outlined in the guideline, we also extract crowd behaviors from real-life footages to compare qualitatively the simulation results with informed expectations from observations.
Component tests
During the component testing phase, we check various fundamental aspects of egress to ensure that the algorithms are performing as intended The most fundamental aspects of egress are the occupants' movement within the building. The movement governs the usage of buildings space as egress route and the time needed for evacuation. To model this, it is important to make sure the virtual agents is moving at the speed as intended and their movements respond to the physical geometry of the building. We run through the elementary test scenarios described in IMO guidelines. The scenarios include:
Tests on Movement Speed
- 1. Walking in corridor (IMO Test 1)
- Geometry - A corridor of 2 m wide and 40 m long
- Population - 1 person with a walking speed of 1 m/s
- Expected results - Person covers this distance in 40 s
- Simulation Result
Video of a typical simulation run (plan view) Numerical results - total time taken to cover 40 m = 40 +/- 1.5 second for 10 simulation runs
- 2. Exit flow rate (IMO Test 4)
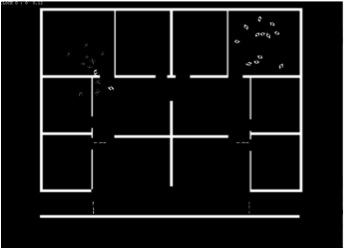
- Geometry - A room of size 6m by 5 m with a 1 m exit locally centrally on the short-sided wall
- Population - 100 people with a walking speed of Type A
- Expected results - The flow rate should not exceed 1.33p/sec
- Simulation Result
Video of a typical simulation run
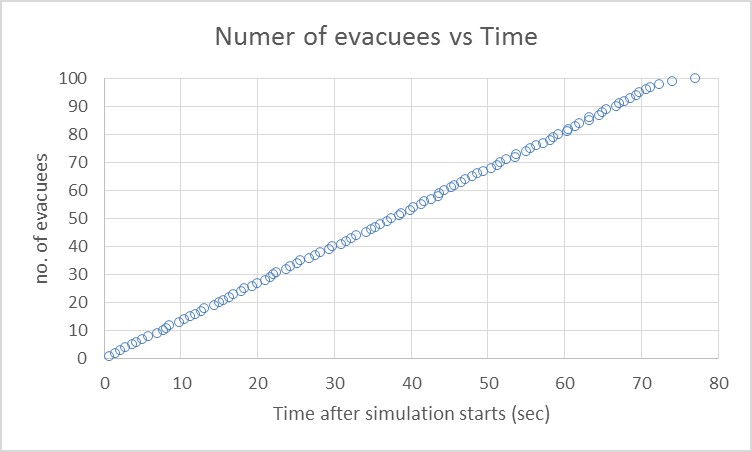
The rate of evacaution of a typical simlation run
Numerical results - average total time taken to exit = 76.5 seconds (10 simulation runs)
- 3. Specific flow rate (Replication of fundamental diagram
- Geometry - A corridor of 2 m wide and 40 m long
- Population - Continous influx of people with a walking speed of Type A
- Expected results
- The agents detect other agents and do not "step on" others
- The crowd collectively moves at a speed in accord to the fundamental diagram of pedestrian flow
- Simulation Result
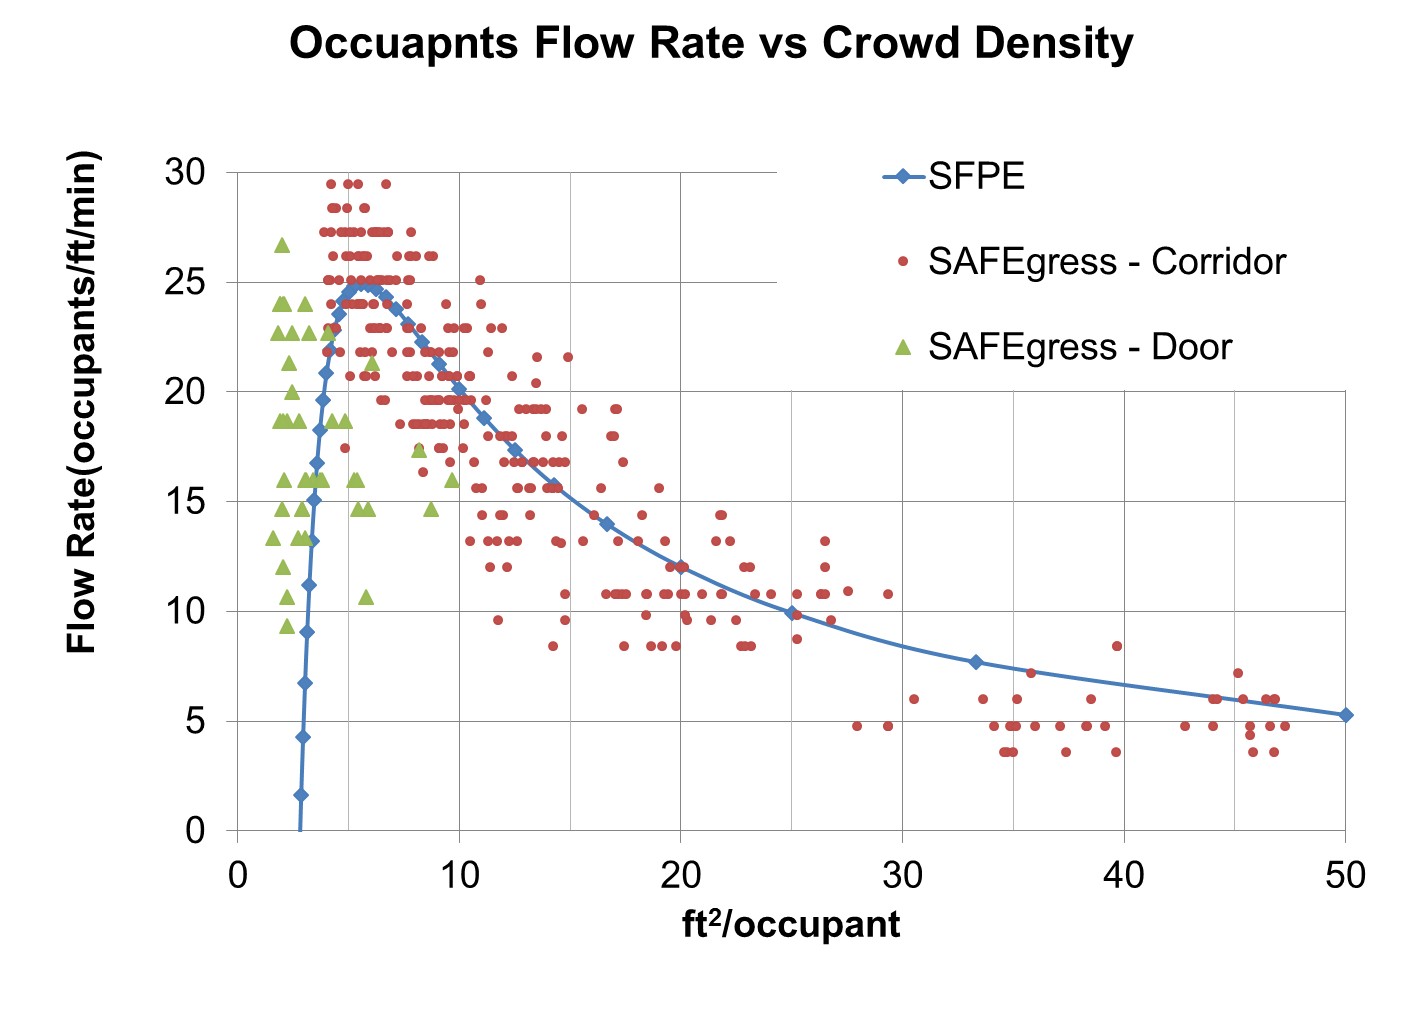 Comparison of simulation results and the theoretical fundamental diagram
Test on Physical Geometry Model
- 1. Rounding corner (IMO Test 6)
- Geometry - A left-hand corner corridor of 2 m wide
- Population - 20 people with a walking speed of Type A
- Expected results - People navigate around the corner without penetrating the boundaries
- Simulation Result
Video of a typical simulation run
Functional Tests (coming up)
During the component testing phase, we check if the model possess the ability to exhibit a range of capacities to perform the desired simulation.
the tests are task specific and are described as follow:
Agent Representation
- Vision
- Detecting physical boundaries
- Detecting special floor objects
- Detecting surrounding neighbors
- Navigating complex environment
- Cognitive module
- Cognitive representation of a spatial environment
- Information from verbal communication or announcement
- Social constructs
- Group affiliation
- Influence to others
- Pre-assigned roles
Representing Threat
- Alarm representation
- Smoke/fire representation
- Toxic gas representation
Qualitative testing (coming up)
Flow and congestion
- Bi-directional flow
- Bottleneck formation
- Exit time with various numbers of openings
Exit behaviors
- Choice of exit
- Assignment of exit
References:
Interim Guidelines for Evacuation Analyses for New and Existing Passenger Ships (June 2002) by MSC-Circ
Case Studies
Rhode Island Station Fire
This model was built to simulate the Station Nightclub Fire in Warwick in 2003, one of the most lethal and well-studied fire accidents involving 456 people and causing 100 deaths. A band accidentally ignited the polyurethane foam installed at the platform during the performance. The fire initiated at 11:08 pm, and evacuation was delayed as patrons were engaged in different activities and were making sense of the situation. The band stopped performing 30 seconds later and started evacuating. One minute 40 seconds later, the main entrance was clogged with people attempting to escape; some began to escape from the windows at the bar area and sunroom. The latest time recorded for an individual escaping window was 4 minutes 8 seconds after initiation of the fire.
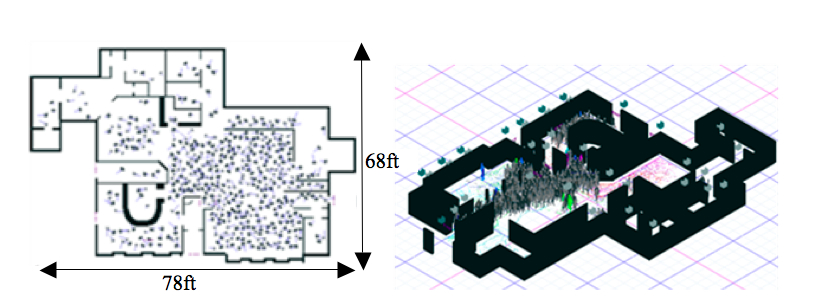
We modeled the geometry of the building and assumed initial distribution of the patrons and employees according to the descriptions in the NIST Investigation Report. There were several important assumptions in this model:
- 1. The physical geometry of building was changed after one minute 40 seconds to allow agents passing through windows and to disable the platform exit which was impassable due to fire.
- 2. The control simulation was run assuming agents with individualistic behavior (going to the closest visible exit).
- 3. The pre-evacuation delay time for each agent was modeled as a truncated normal distribution within the interval [0, 41] seconds.
- 4. The population was modeled as two main types of agents with different travelling speeds and physical body size to represent male and female, following the body dimensions and moving speeds of typical population types suggested by Thompson et al.
- 5. The norm-following rule overrode other social behavioral rules when the average occupant area was less than 2-3 ft2 /person (level of service E for queuing).
 View movie
References: Grosshandler, W., Bryner, N., Madrzykowski, D., and
Kuntz, K. (2005). Report of the Technical Investigation of the
Station Nightclub Fire, Technical Report, NCSTAR 2: Vol. I,
2005. NIST.
Thompson, P., Lindstrom, H., Ohlsson, P., and Thompson,
S. (2003). �Simulex: Analysis and Changes for IMO
Compliance,� Proceedings of 2nd International Conference:
Pedestrian and Evacuation Dynamics, pp. 173-184.
Fruin, J. (1971). Pedestrian and Planning Design,
Metropolitan Association of Urban Designers and Environmental
Planners.
Visualization
Result Visualization
To derive insights from the simulations to aid egress design, we are interested in exploring different statistical and data visualization techniques [Agrawala et al. 2011; Andrienko et al. 2007; Gatalsky et al. 2004; Tufte 2001; Schreck et al. 2009] to organize and to display the results. Figure 7 shows illustrations of visualization schemes that are being investigated. We plan to work closely with NIST, Stanford University Public Safety Department and the event managers from Stanford Athletic Department, and other interested parties to address key concerns in egress design and evacuation planning. The research entails an iterative design and evaluation process with selected users. By understanding the expectation of the users and their experience in using simulation tools to aid design decision, the objective of this research task is to develop and to tailor the visualization tool to suit user expectation and present the results in a systematic and visual manner.
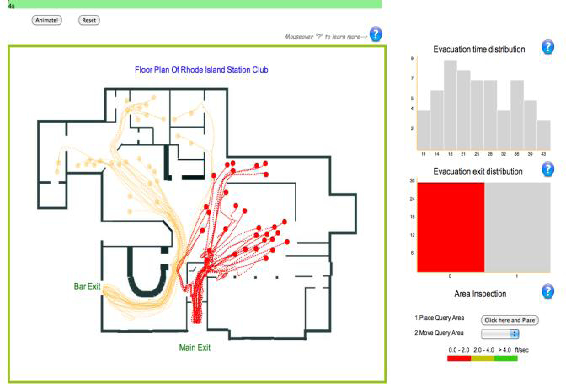
An interactive visualization environment (currently under design and development)
References:
Agrawala, M., Li, W., and Berthouzoz, F. (2011). "Design principles for visual communication," Communications of the ACM, pp. 60-69, Apr..
Andrienko, G., Andrienko, N., & Wrobel, S. (2007). "Visual analytics tools for analysis of movement data," ACM SIGKDD Explorations Newsletter, 9(2), 38-46.
Gatalsky, P., Andrienko, N., & Andrienko, G. (2004). "Interactive analysis of event data using space-time cube," Proceedings of Eighth International Conference on Information Visualisation 2004. IEEE.
Tufte, E.R. (2001). The Visual Display of Quantitative Information, Graphics Press.
Schreck, T., Bernard, J., Von Landesberger, T., & Kohlhammer, J. (2009). "Visual cluster analysis of trajectory data with interactive Kohonen maps," Information Visualization, 8(1), 14-29.