Expo 2010 will be held in Shanghai, China and is a scheduled World Expo in the grand tradition of international fairs and expositions. The theme of the exposition will be "Better City Better Life" and signifies Shanghai's new status in the 21st century as a major economic and cultural center. It is expected to generate the largest number of visitors in the history of the world's fairs in terms of gross numbers. The Expo will take place from May 1 - October 31, 2010. For the first time in history, the Shanghai 2010 Expo will feature a highly sophisticated online version called "Online Expo Shanghai".
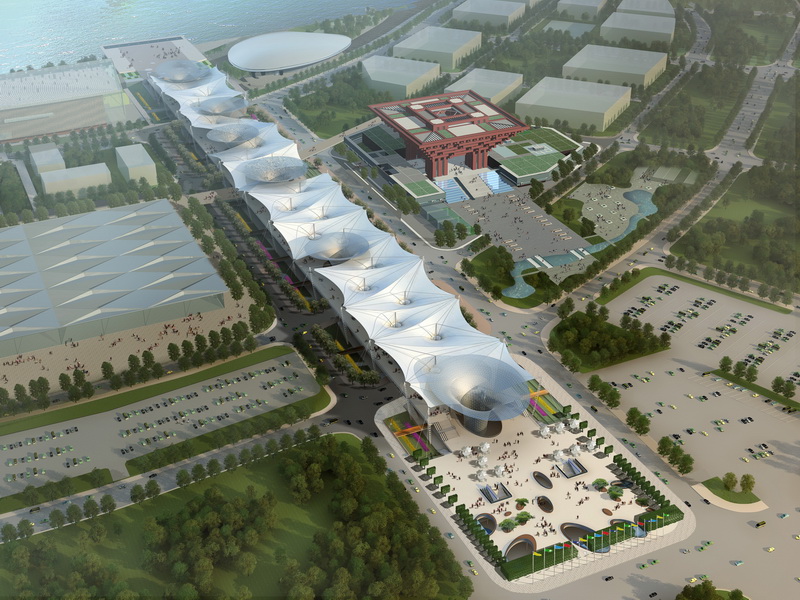
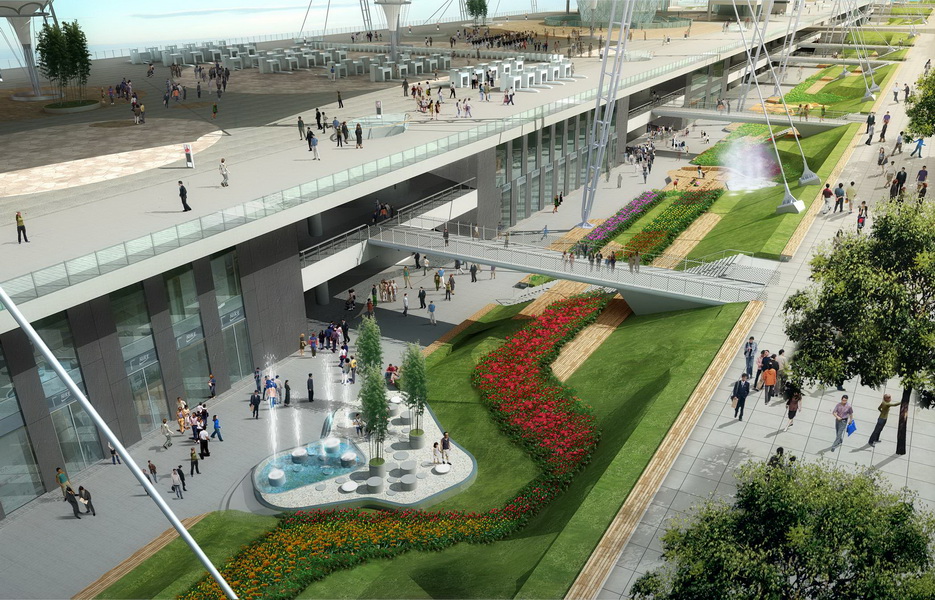
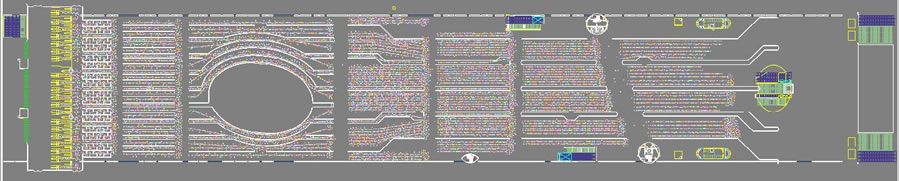
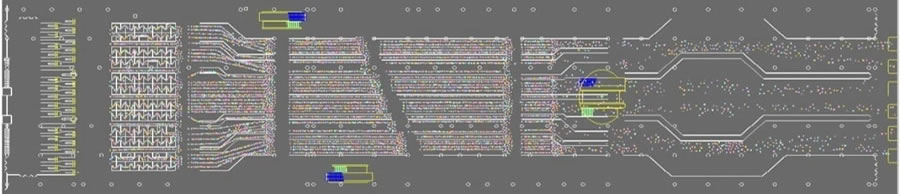
In this case study we made simulation analysis for the main entrance of Expo area: "Shang nan lu" Entrance, which comprises 5 floors in all. Tourists mainly enter from floor 2 and underground floor 2.
Secure Capacity Test
According to the Level of Service criterion:
| Level of Service | Distance between people in queue (m) |
|---|---|
| A | >=1.2 |
| B | 1.1~1.2 |
| C | 0.8~1.1 |
| D | 0.6~0.8 |
| E | 0.5~0.6 |
| F | <=0.5 |
We tested the capacity of floor 2 and underground floor2 under LOS E and:
According to simulation reasult, we recommend that the Secure Capacity of floor 2 is 1, 4000
According to simulation reasult, we recommend that the Secure Capacity of underground floor 2 is 7400
We also tested the capacity under different Service level:
Capacities of floor 2 under different Service level
| Level of Service | Distance between people in queue (m) | Capacity(p) |
| A | 1.2 | 7800 |
| B | 1.1 | 8300 |
| C | 0.8 | 10700 |
| D | 0.6 | 13200 |
| E | 0.5 | 15000 |
| F | 0.4 | 18000 |
Capacities of underground floor 2 under different Service level
| Level of Service | Distance between people in queue (m) | Capacity(p) |
| A | 1.2 | 4700 |
| B | 1.1 | 5200 |
| C | 0.8 | 5800 |
| D | 0.6 | 7200 |
| E | 0.5 | 8300 |
| F | 0.4 | 9800 |
Test of Safety Inspection Time Average
| Safety Inspection Time Average (value of setting) | Safety Inspection Time Average (simulation result) |
| 10s | 16.2s |
| 15s | 24s |
Note: Simulation result is grater than setting value, because it contains queuing and walking time. The setting value is the expectation of Exponential Distribution.
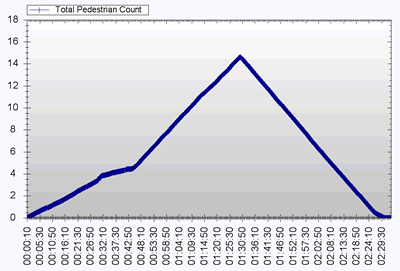
After tests we found that, if the Safety Inspection Time is about 24s (seting value 15s) for each tourist, the number of tourists will exceed Secure Capacity both in floor 2 (over 20,000) and underground floor 2(over 1,400).
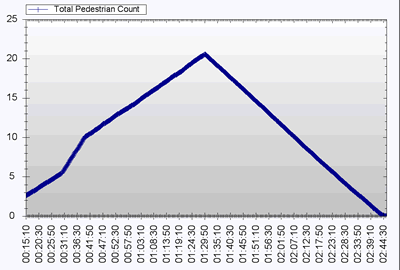
Number of Tourists in floor 2
Number of Tourists in underground floor 2
So we recommend that the Safety Inspection Time Average is better to be 16s for each tourists.
Level of Queuing Service
According to psychology, tourists may feel:
- time of waiting is longer than time of service
- time of anxiety is longer
- uncertain waiting is longer than certain waiting
- unfair waiting is longer than fair waiting
- the higher value of service worth longer waiting
- waiting along is longer than waiting with friends
We tested average time for each tourist spending on entry:
| Floor | Traffic Volume (p/h) | Inintial Tourists Count | Safety Inspection Device | Entry Time Average(min) | Entry Time Max(min) |
| 2 | 28640 | 6800 | 80 | 27.09 | 75.9 |
| B2 | 21360 | 5200 | 60 | 24.55 | 83.97 |
| 2 | 28640 | 5500 | 80 | 23.87 | 70.23 |
| B2 | 18270 | 3500 | 52 | 24.07 | 62.92 |
| 2 | 12000 | 3000 | 35 | 20.98 | 53.02 |
| B2 | 12000 | 3000 | 35 | 22.7 | 51.7 |
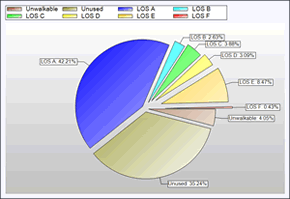
And the area proportion of Density LOS for floor 2 under different traffic volume:
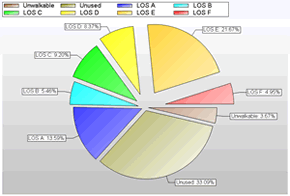
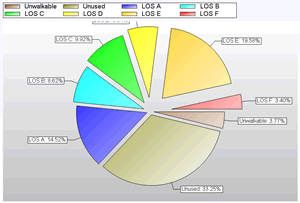
LOS of Peak
LOS of Normal
LOS of valley
Density map of floor 2 under different traffic volume:
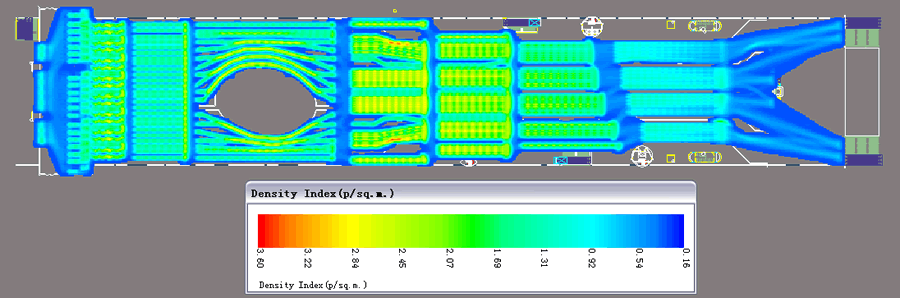
Density map of peak
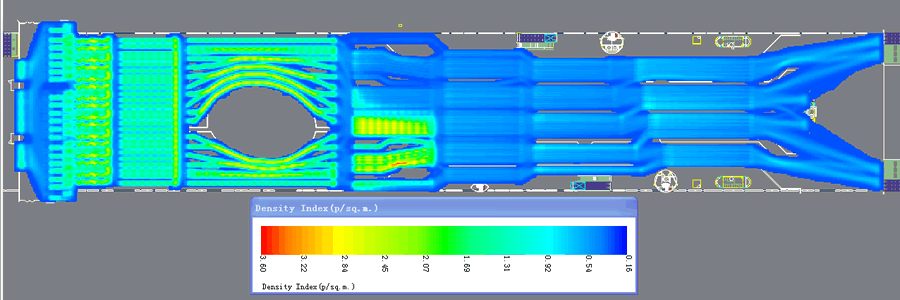
Density map of normal
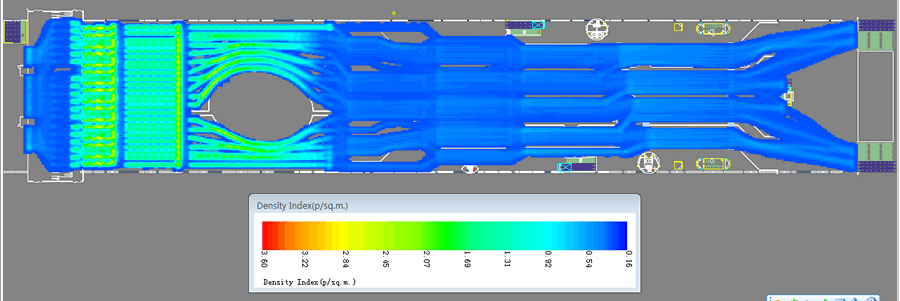
Density map of valley
Then we tested waiting time in different Queuing level, in this way we can can reduce the uncertainty of waiting time.
| Queue Level | Queue Form | Line Count | Waiting Time(min) |
| 1 | line,tilted in end | 24 | 2.68 |
| 2 | line,tilted in begining | 23 | 3.37 |
| 3 | line, equare length | 41 | 4.94 |
| 4 | polyline | 38 | 5.38 |
| 5 | arc | 18 | 5.13 |
| 6 | line, equare length | 25 | 3.18 |
| 7 | snake & line | 23 | 2.67 |
| 8 | line, interlaced | 40 | 0.7 |
Floor 2 - Waiting time in different Queuing level
| Queue Level | Queue Form | Line Count | Waiting Time(min) |
| 1 | polyline | 27 | 2.27 |
| 2 | line,tilted in end | 27 | 3.93 |
| 3 | line,tilted in begining | 27 | 4.51 |
| 4 | polyline | 31 | 5.28 |
| 5 | snake & line | 17 | 4.42 |
| 6 | line, interlaced | 31 | 1.95 |
Underground Floor 2 - Waiting time in different Queuing level
Throughput rate of Safety Inspection Device
| Floor | Safety Inspection Device | Safety Inspection Time Average (setting value) | Theoretical Throughput Rate | Simulation Result |
| 2 | 80 | 10s | 28,8000/h | 22,2000/h |
| 2 | 35 | 10s | 12,6000/h | 10,4000/h |
| B2 | 60 | 10s | 21,6000/h | 15,7000/h |
| B2 | 52 | 10s | 18,7000/h | 13,2000/h |
| B2 | 35 | 10s | 12,6000/h | 10,1000/h |
Note: Simulation Result would be lower than Theoretical Throughput rate, because of the queuing and walking time.